Related Projects
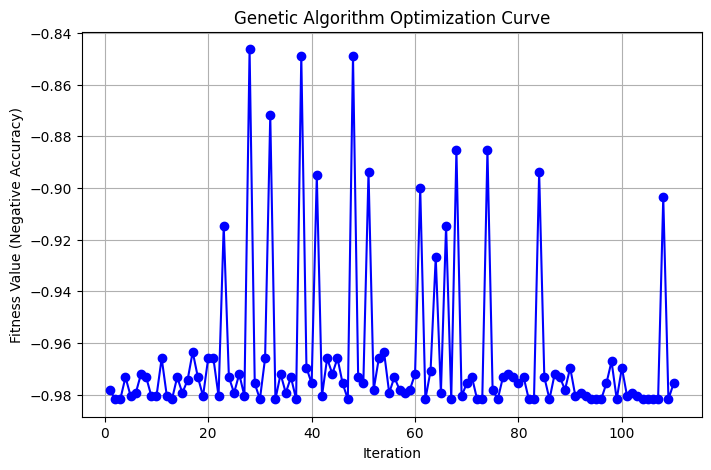
Optimizing Heart Disease Prediction Models Using Genetic Algorithm and Neural Architecture Search
Machine Learning
View Details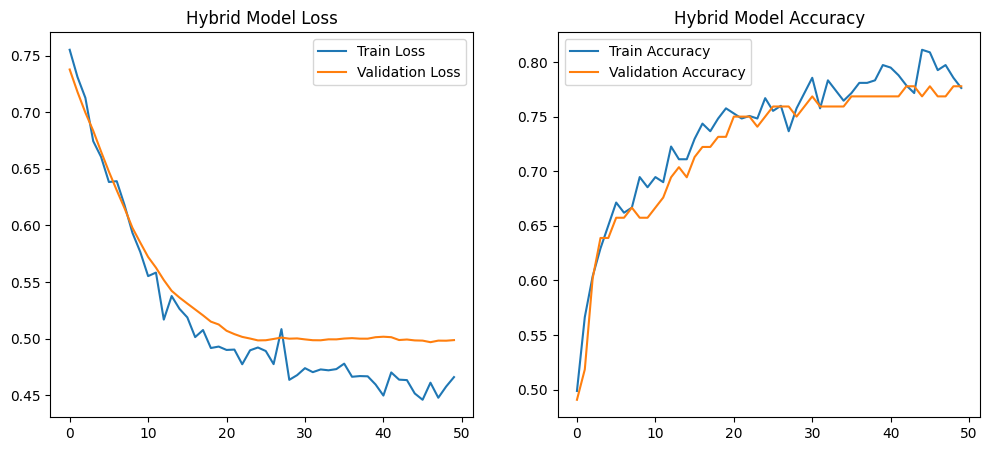
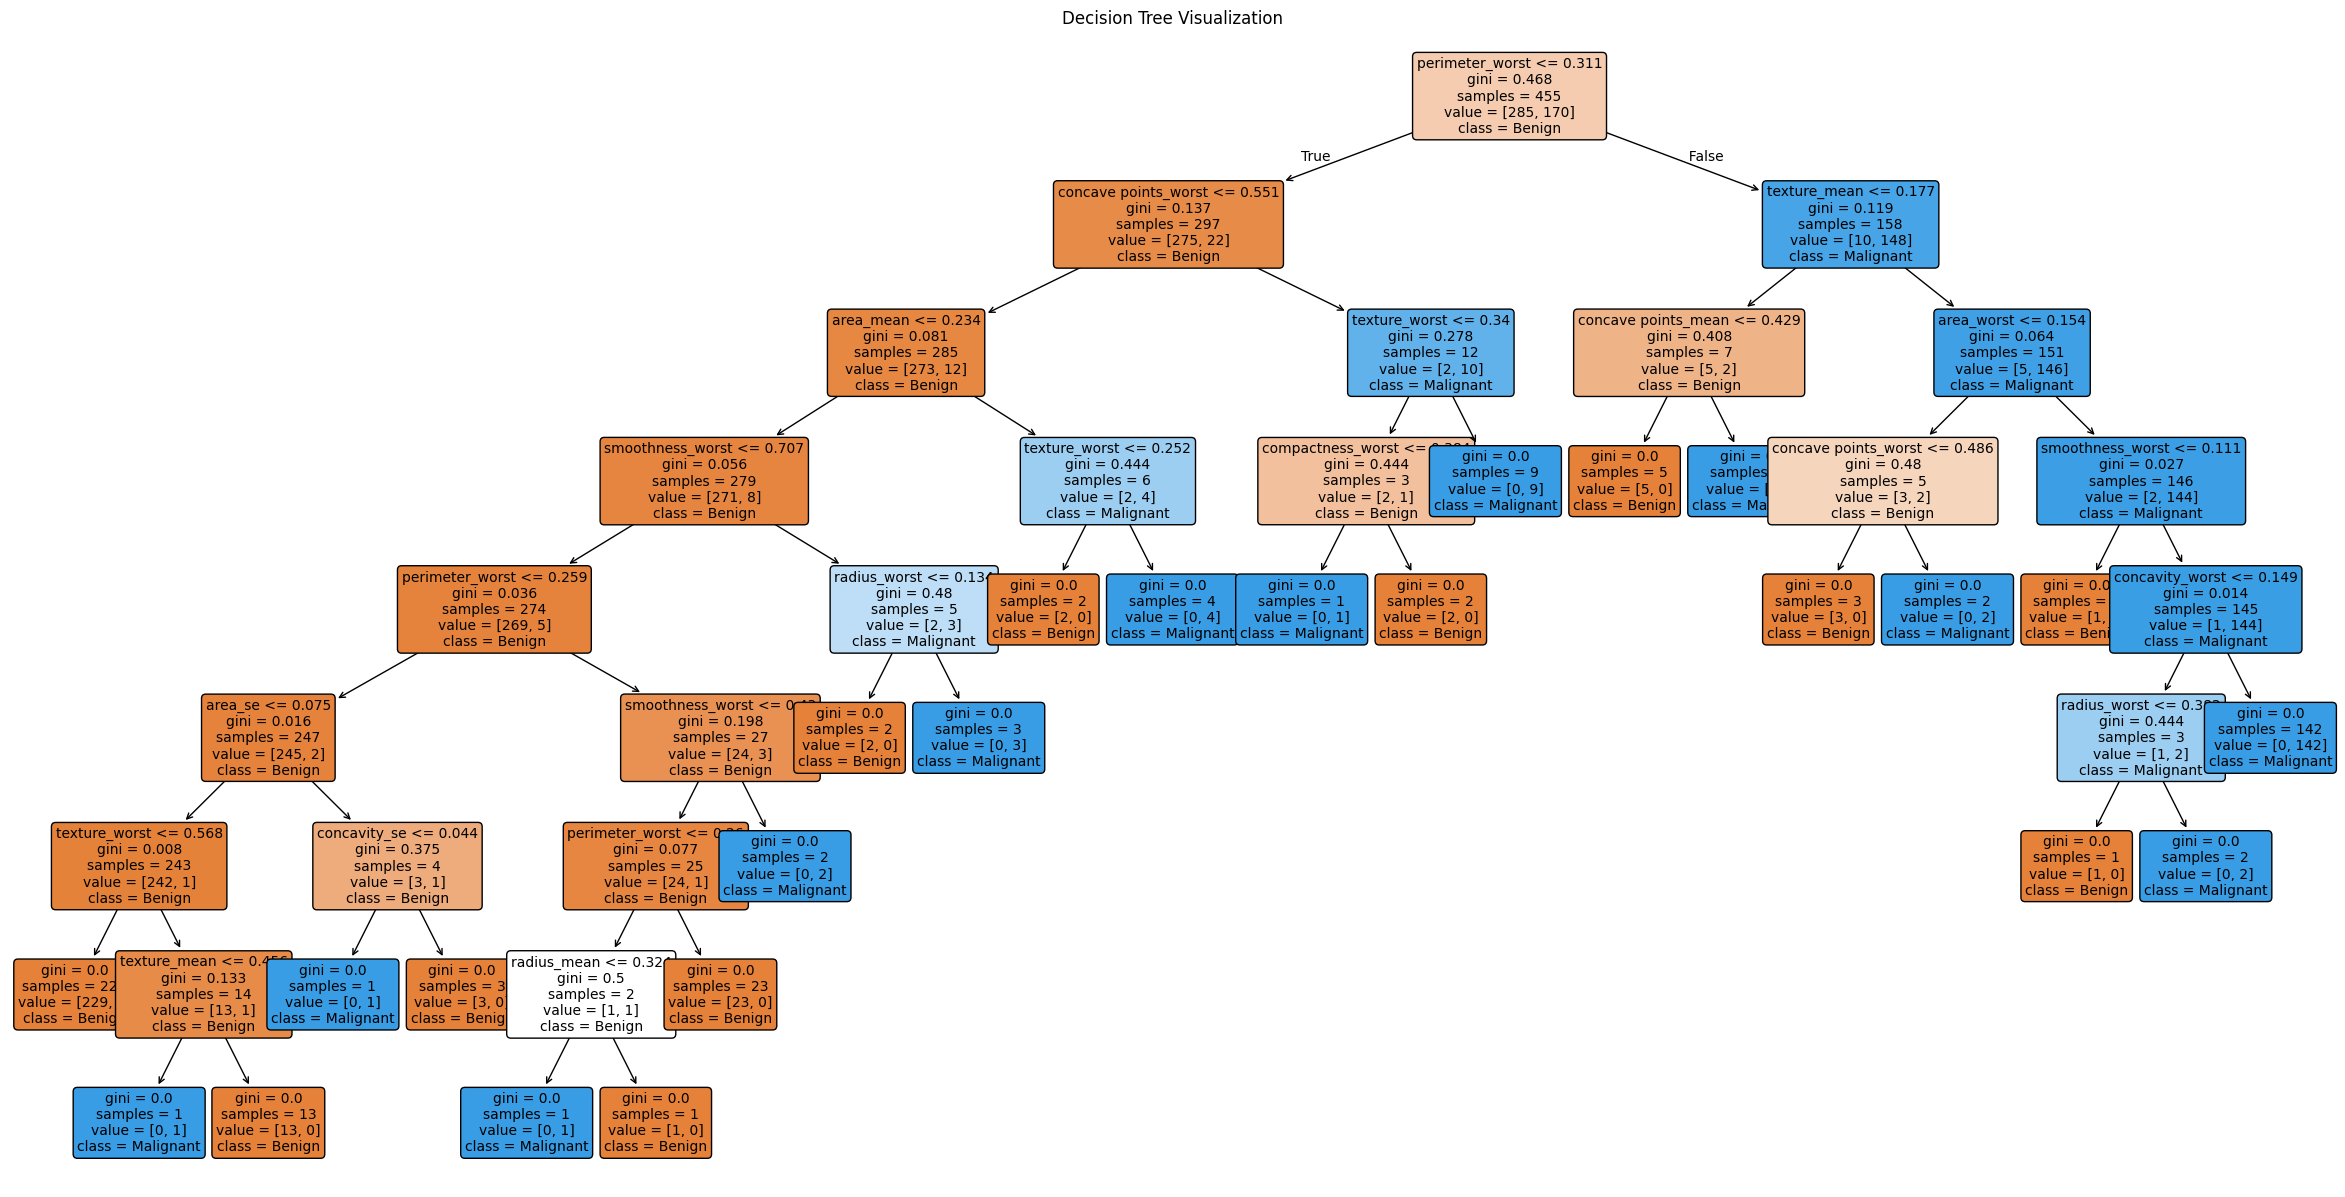
Applies PCA to the scikit-learn breast cancer dataset to reduce feature dimensionality and visualize principal component structure.
The notebook loads the Breast Cancer dataset via <code data-start=\"4904\" data-end=\"4926\" style=\"font-family: SFMono-Regular, Menlo, Monaco, Consolas, "Liberation Mono", "Courier New", monospace; color: rgb(214, 51, 132);\">load_breast_cancer()</code>, scales all features with <code data-start=\"4953\" data-end=\"4969\" style=\"font-family: SFMono-Regular, Menlo, Monaco, Consolas, "Liberation Mono", "Courier New", monospace; color: rgb(214, 51, 132);\">StandardScaler</code>, then fits <code data-start=\"4981\" data-end=\"4986\" style=\"font-family: SFMono-Regular, Menlo, Monaco, Consolas, "Liberation Mono", "Courier New", monospace; color: rgb(214, 51, 132);\">PCA</code> to capture principal components. It examines explained-variance ratios, projects the data onto the first two components for scatter‐plot visualization, and discusses how much variance is retained by successive components.
Machine Learning
View Details